Mixed Signals
by Brian Sokolowski, CFA
Bluebird Wealth Management
The need to parse and balance contradictory information is not unique to the current investment landscape, it is a foundational element in all market environments. However, whether due to the remarkably “easy” 2017 for global stock markets (with undeniably strong data, albeit some headline risk courtesy of politics in the US), or a significant change in the data, it feels as if 2018 holds the most cross currents that we have seen in multiple years.
Markets
Market indices rarely move in unison, but divergences in the first half of 2018 were especially wide with small cap stocks returning 7.6% (as measured by the Russell 2000 Index) and the NASDAQ returning 9.4%, significantly outpacing the Dow Jones Industrial average return of negative 0.7%.
From a sector perspective, defensive sectors such as Utilities (+0.1%) and Real Estate (+1.8%) lagged growth-exposed sectors such as Energy (+6.8%) and Technology (+9.5%). The confluence of these results (strong performance from higher risk sectors and size factors) would seem to indicate a strong stock market, but the S&P 500 only returned 2.6% in the first half, which would annualize to a below-average 5.2% return.
The gap between US and non-US markets was also significant, with international markets posting a decline of 3.6% in the first half of 2018 as measured by the MSCI All-Country ex-US Index, approximately 6% worse than the S&P 500. The gap was particularly large between the US and China, with Chinese returns approximately 20% worse than US returns.
Economic Data
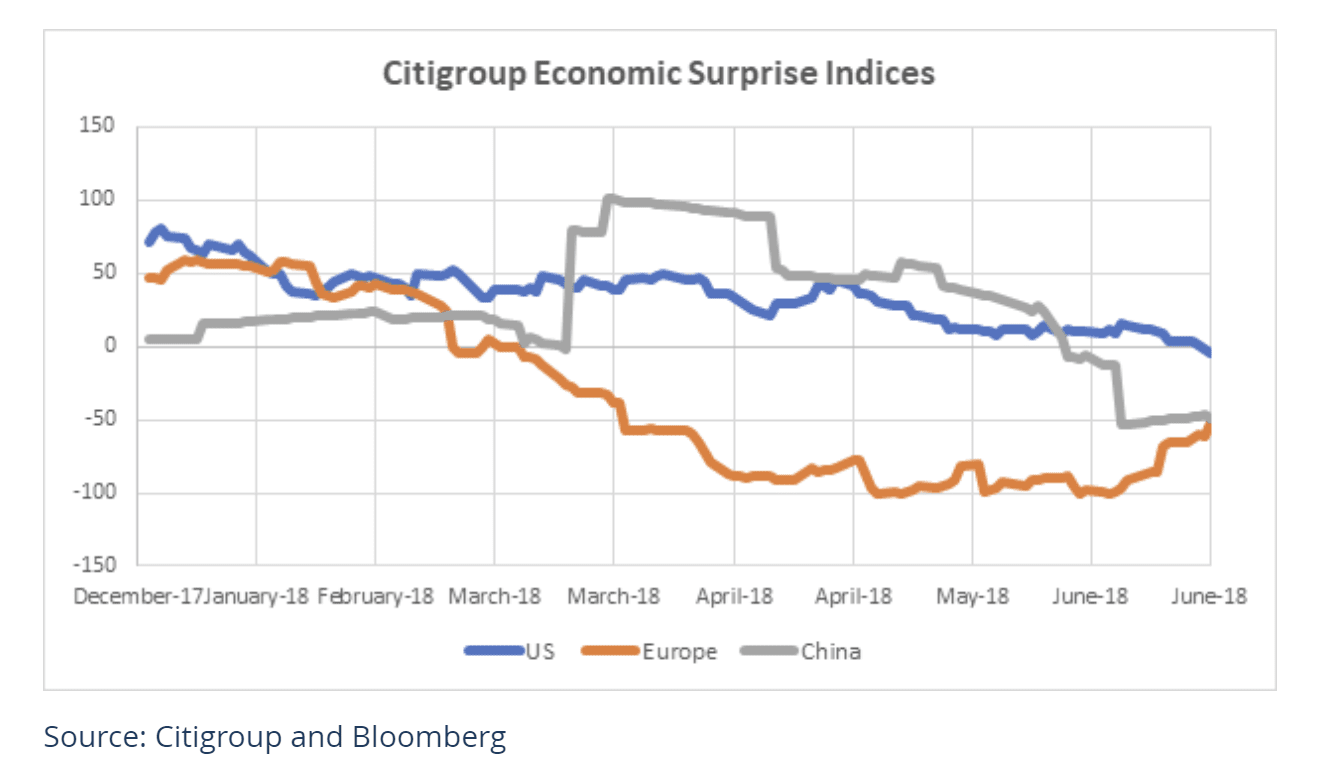
As measured by Citigroup, economic data generally remained positive in the US throughout most of the first half of 2018, relative to expectations. This is in sharp contrast to Europe, however, where data (relative to expectations) disappointed at levels not seen since the financial crisis, even surpassing the Eurozone crisis in 2011. Chinese data was also poor in the second quarter, with the Citigroup China Economic Surprise Index spending most of the quarter in negative territory. (See chart below – readings above zero indicate positive economic surprises relative to expectations, and below zero indicate negative readings relative to expectations.)
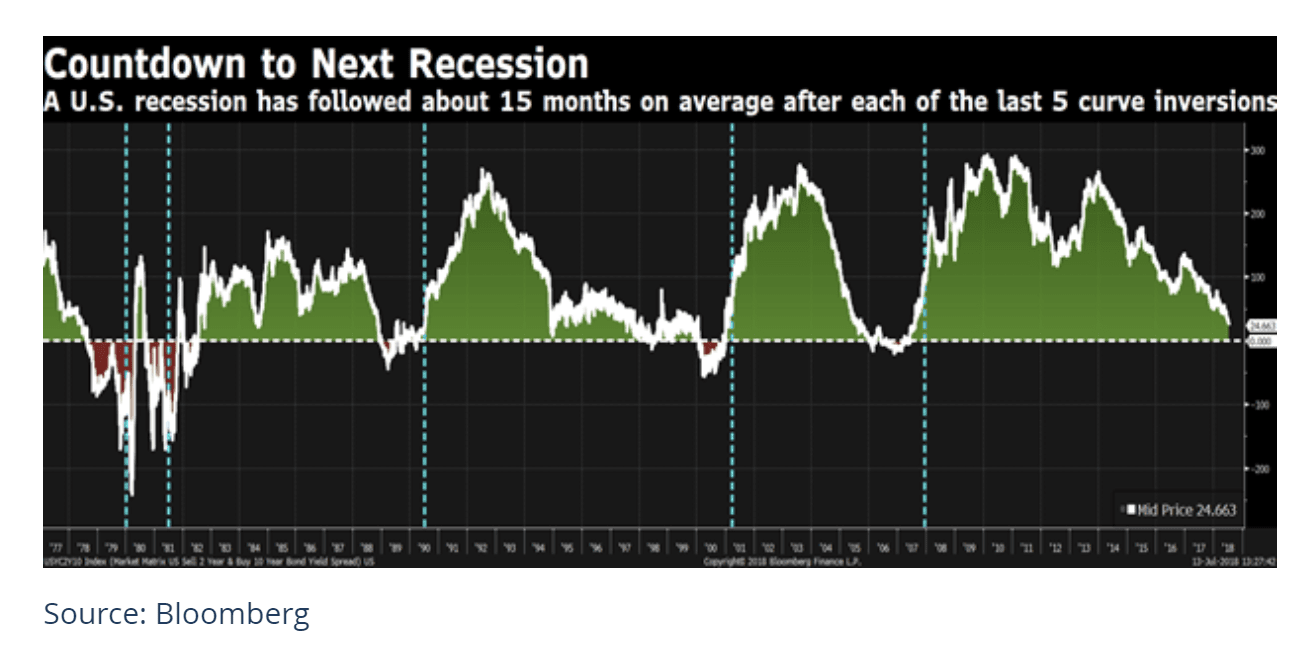
Forward-looking economic indicators are also mixed. On the positive side of the ledger, unemployment in the US continues to fall and now hovers around 4%, with modestly increasing wages. Oil prices have been strong, with West Texas Intermediate up more than 20% in the first half. On the negative side, copper prices have plummeted recently, and are now down approximately 15% from the early June peak. Perhaps most concerning to investors has been the spread between 2 Year and 10 Year Treasury Bonds, which has been contracting through 2018 and sits at a very narrow 26 basis points as of mid-July (see chart). The 2/10 spread has been an excellent indicator of a coming recession – when the yield curve inverts. However, some of the strongest equity market returns have occurred when the spread is narrow but positive. With narrowing a necessary precursor to inversion (but inversion not always following a narrowing spread), this critical indicator carries its own contradictions. Our thinking is to not fear a narrowing curve, but to reassess when the curve eventually inverts.
The Big Contradiction
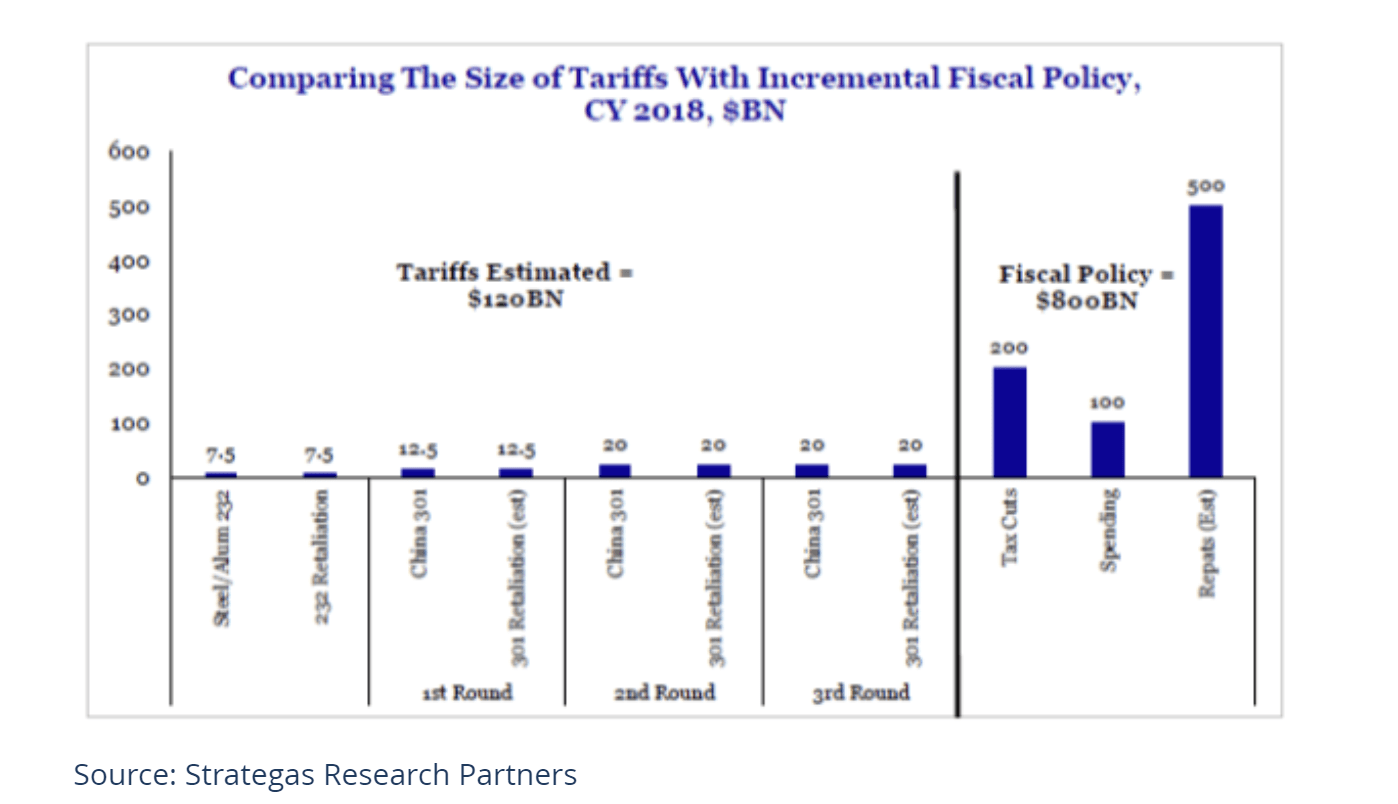
Signals are especially contradictory when considering two large market items: earnings and potential disruption from a trade dispute. Corporate earnings in the US are unquestionably strong. The first quarter earnings season was extremely robust, with 24% earnings growth and a 7% earnings surprise, according to Bloomberg data. Similar results are expected for the upcoming second quarter earnings season. While the earnings results are boosted by tax reform in the US, revenue growth is extremely robust as well. 2Q18 should mark the seventh consecutive quarter with S&P 500 revenue growth more than 5%, a streak not reached since eight consecutive quarters in 2010 as the economy recovered from the financial crisis. The very bright earnings picture is threatened by the dark storm clouds of global trade disputes. While on the surface, if fully implemented, the disruption from announced tariffs are containable, investors would likely continue placing a decreasing multiple on earnings as the situation develops and supply chain risks and surprises are revealed. Strategas Research estimates the direct economic impact from currently announced tariffs to be $120 billion, much smaller than the estimated $800 billion positive impact from stimulative fiscal policy (see chart below). However, the market does not like uncertainty, and as risks increase for tariff-related earnings surprises at individual companies (such as Harley Davidson), valuation discounts will be increasingly applied to wider swaths of the market.
Valuation
One of the bear cases over the last few years has been “excessive” valuation (a characterization with which we have disagreed – the S&P 500 spent a few years 1-2 standard deviations above its historical P/E average on a forward basis, but above-average valuation levels have historically been supported during times of low inflation). The 2018 combination of very strong earnings growth and limited price appreciation has resulted in a current P/E multiple of 16.7x 2018 EPS estimates, which is almost back in line with the historical average of 16x. While valuation is a poor near term predictor of market returns, a lower P/E serves to increase expected returns over the longer term.
Outlook
Considering the various signals, the market reaction has been logical. The economy and corporate earnings look very good (particularly in the US); copper and other global trade related indicators are flashing warning signals over potential trade disruption; and less-exposed portions of the US market (such as small caps and software) continue to act well. Recognizing our limitations in handicapping such an event, we believe the tea leaves point towards President Trump’s current stance as being a negotiating tactic to modestly reduce the trade deficit with China and score political points with a voting bloc that was responsible for his election, while remembering that this President is keenly aware and sensitive to what the stock market level implies about his job performance.
Our base case is that the public negotiating and rhetoric drags on for some time, as previewed by the President’s past indication that the tax cuts have given him some headroom to negotiate on trade, despite a potential negative impact to markets and economic growth. We believe that Mr. Trump is not prepared to sink the economy (and market) over a runaway trade dispute. Absent a full-blown trade war, we believe an overheating economy is the biggest risk to the stock market.
Regarding fixed income, we see little reason to extend duration given the flat yield curve, as we do not believe slightly higher yields are worth the extended duration risk. While corporate credit spreads remain tight, because we are staying short and buying strong credits, we still prefer corporate debt to government debt although not to the same extent as in the past and with increased selectivity.
Bluebird Wealth Management, LLC

Metrowest Office
(508) 359-4349
266 Main St.
Suite 19B
Medfield, MA 02052
North Shore Office
(978) 775-1287
12 Oakland St.
Suite 308
Amesbury, MA 01913
We serve individuals and families throughout the United States.
Bluebird Wealth Management, LLC

Metrowest Office
266 Main St.
Suite 19B
Medfield, MA 02052
+1 (508) 359-4349
info@bluebirdwealthmanagement.com
North Shore Office
12 Oakland St.
Suite 308
Amesbury, MA 01913
+1 (978) 775-1287
info@bluebirdwealthmanagement.com
We serve individuals and families throughout the United States.


