October 2018 Stock Market Decline
by Brian Sokolowski, CFA
Bluebird Wealth Management
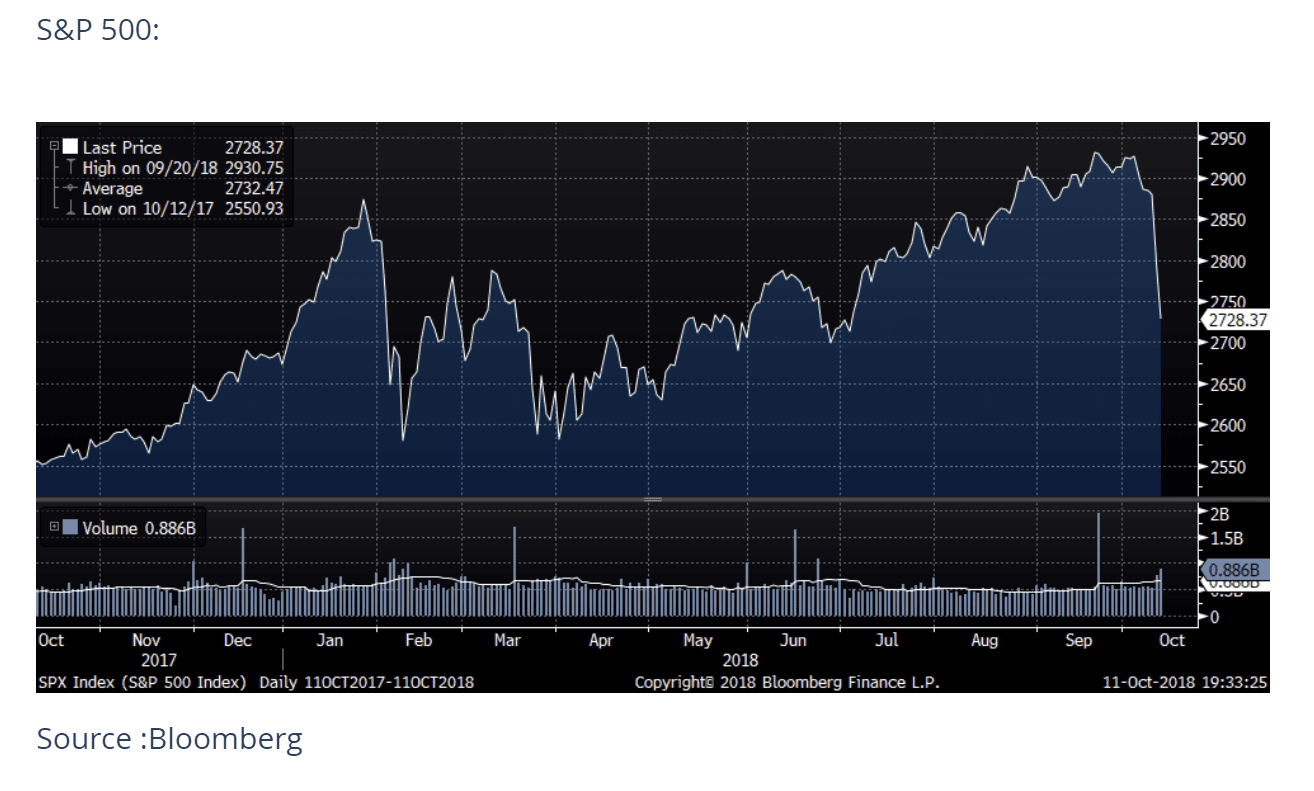
“DOW DROPS 1300 POINTS IN TWO DAYS!” screamed the Breaking News banner at the bottom of the CNBC screen this afternoon. It is important to note that 1300 points isn’t what it used to be, as it is only about 5% as measured on a percentage basis. Are those losses trivial? No, of course not. And the pain is deeper in many portions of the stock market. But a 5% two-day loss is not all that significant historically – which could either argue for an investor to have a calm response to this selloff, or that there are still significant losses to come before markets find a bottom.
What happened (or is happening)?
While losses to well-known US indices began to deepen meaningfully over the last two trading sessions, there has been some weakness building under the hood for at least a few weeks now. The S&P 500 peaked on September 29th and is now down almost 7% from its peak. The Russell 2000 Index of small cap stocks peaked back on August 31st and is now off 11%, and in correction territory. The FANG group, long a market leader, peaked back on June 20th and now sits 18% off its highs, almost in bear market territory. No major markets outside of the US are positive for the year in dollar terms, with the Nikkei turning red for the year last night.
Why are stocks selling off?
We see at least four potential factors for the selloff:
Weakening economic data. Housing activity and auto sales have been disappointing in recent weeks, and this week two large industrial companies (PPG and Fastenal) warned investors on slowing sales and higher input costs. The latter appears due to:
Tariffs finally impacting the industrial economy. While consumer confidence continues to soar, making new highs according to the Confidence Board survey, the industrial economy is beginning to be pressured as tariffs are implemented. Economists estimate that the tariffs could reduce US GDP by up to 1%, but company-specific risks are even greater as investors begin to find out where the land mines will appear.
Important technical levels were breached (namely the 200 day moving average for the major indices), leading to accelerated selling programs from quantitative strategies.
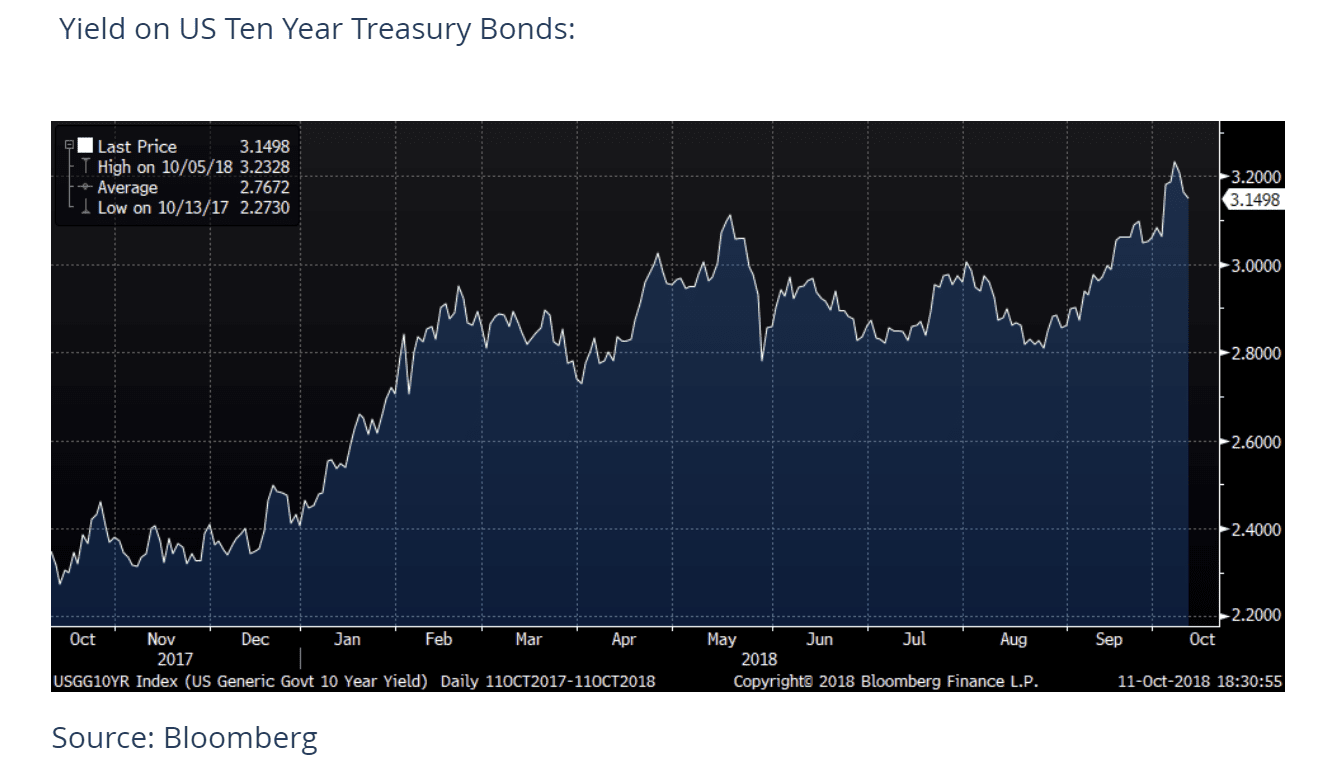
Rising interest rates are the key driver of this selloff, as indicated by the fact that defensive assets which typically outperform when the market becomes concerned about a growth slowdown have not provided much in the way of protection this time around. The yield on the 10 Year Treasury Bond declined only 10 basis points on a 5%+ pullbacks in stocks over two days; credit spreads on corporate bonds have not widened in any meaningful way; and while defensive sectors led equity markets during yesterday’s decline, they generally outpaced declines in the market today, offering little respite over the two day span. If this selloff were primarily due to fears of a growth slowdown, these defensive instruments would likely be giving different signals.
Why are interest rates rising, and why is this bad for the stock market?
Economists and investors have been expecting interest rates to rise for years, and these predictions have generally been correct, although the pace has been slower than many expected. Rates have spiked recently, with the yield on the US 10 Year Bond rising 0.50% over the past two months, to a high of 3.25% earlier this week. Reasons for the longer term and recent rally in rates include:
-The Federal Reserve normalizing short term interest rate policy
-Fed balance sheet unwind from overly accommodative policy
-Fear of the Fed driving rates up too quickly, or to a damaging level, due to recent hawkish comments from relatively new Chair Jerome Powell.
-Rising inflation – which drives up the nominal cost of money (interest). It is interesting to note that the largest single day spike in long term interest rates in recent weeks occurred last Wednesday, October 3rd, the same day Amazon announced the increase of its minimum wage to $15 per hour, as the market fears a tight labor market will lead to higher wage inflation. Tariffs are also inflationary, which investors have been reminded of by Fastenal and PPG this week.

Higher interest rates can be a negative for the stock market in a few ways. First, higher interest rates make bonds relatively more attractive than they were with lower interest rates and therefore provide increased competition to stocks for investment capital. Second, as we are likely witnessing with slowing housing and auto activity, higher interest rates slow the economy, all else equal.
Where to from here?
Due to the mature economic cycle in the US, almost-full employment, rising inflation and interest rates, declining liquidity, and a 9+ year bull market in equities, the questions of whether or not we have seen the peak of the stock market for this cycle are reasonable. Some factors to consider:
-S&P 500 earnings are forecast to grow 10% in 2019 (on top of 17% in 2018) and reach $179 per share. Analysts are almost always overly optimistic, but even if we haircut the estimate to $175, the market trades at a 15.5x P/E on 2019 estimates. This is a slight discount to historical averages, and still appears cheap in a modest (2-3%) inflation economy where interest rates remain historically low.
-Valuation is important for long term returns, and for risk/reward scenario analysis, but markets can of course overshoot to both the up and down sides. But it is difficult to envision (absent an exogenous event or a significant markdown in earnings estimates) a 15.5x P/E declining much further in a 2.5-3.5% GDP environment. A further 10% pullback in the market, for example, would indicate a 14x P/E for the market – an apparent bargain given the current strong economy and level of inflation and interest rates.
-We would be more concerned if this were a growth scare, as opposed to a reaction to higher interest rates. Higher rates can increase volatility and eventually bring about a recession (and therefore a deeper market selloff), but they can also be the symptom of a healthy economy and co-exist with a favorable stock market.
-Short-term timing on when to buy market declines is very challenging, and we accept that we are unable to pick bottoms. However, there are a few encouraging signs of capitulation or exhaustive selling, including a 1:12 Advance/Decline Ratio yesterday and a 1:7 ratio today, 2/3rds of S&P 500 stocks in correction territory, and 96% of Technology stocks in correction territory (Bloomberg data). While a bounce may not occur tomorrow or this week, these seemingly negative factors are actually helping to flush negative sentiment and tend to create the groundwork for improved conditions.
-On a company specific basis many quality growth companies which were getting very expensive have corrected in the neighborhood of 20%, and we are finding some interesting opportunities to selectively add exposure for our clients at lower prices.
I look forward to your questions or comments.
Bluebird Wealth Management, LLC

Metrowest Office
(508) 359-4349
266 Main St.
Suite 19B
Medfield, MA 02052
North Shore Office
(978) 775-1287
12 Oakland St.
Suite 308
Amesbury, MA 01913
We serve individuals and families throughout the United States.
Bluebird Wealth Management, LLC

Metrowest Office
266 Main St.
Suite 19B
Medfield, MA 02052
+1 (508) 359-4349
info@bluebirdwealthmanagement.com
North Shore Office
12 Oakland St.
Suite 308
Amesbury, MA 01913
+1 (978) 775-1287
info@bluebirdwealthmanagement.com
We serve individuals and families throughout the United States.

